So far we’ve drawn graphs where the relation is something like:
Something = something else
A typical example might have been:

These have all been equations, because they’ve had two expressions with an equals sign between them. Now what about if you have another sign instead of the equals sign? What about if you have something like this:

Now we’ve got a larger than or equals to sign. How are we supposed to graph this? Well, it’s easy if we split this inequation up into two parts. One part is the part with an equals sign in it, and the other part is the one with a larger than sign in it:
is the same as AND 
So we can plot the graph in two bits. First, we
just need to plot the bit, which we already know how to
do. It looks something like this:
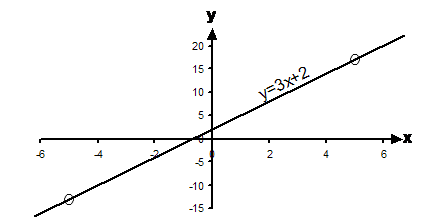
Now what about the other part of the graph – the part? Well,
this basically says any value of y that is larger than 3x + 2. We
already have a line marking out . Values of y that are larger
than this line are simply values above this line. So to mark out the part of the
graph, I need to shade in the area above the line, because any point
above the line counts as the part. So the overall graph should
look something like this:
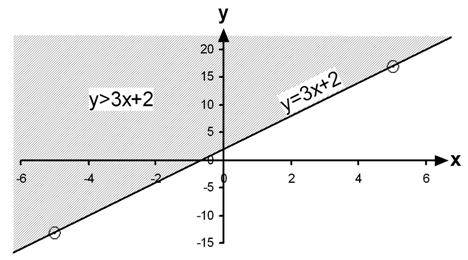
We can see the two bits of the graph now – there’s
the bit
which is the line itself. Then there’s the which is the shaded part above the
line. Now what would have happened if there was a different sign in the
relation – a smaller than or equals to for instance:

Once again we can split this inequation up into two parts for the graph:
is the same as AND 
So one part of this inequation is the same – the part. But the
different part is the part. This is going to be another
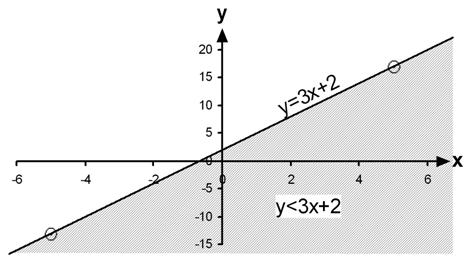
area we have to shade in on the graph. But this time it’s an area for values
of y that are smaller than 3x + 2. This means the area is going to be below
the line.
So the overall graph will look like:
So we’ve covered how to graph inequations which have
either a ‘ ’
or ‘
’
or ‘ ’
sign in them. What about inequations which have a ‘>’ or ‘<’ symbol in
them? Let’s try the same relation we’ve been using but with a ‘>’ symbol in
it:
’
sign in them. What about inequations which have a ‘>’ or ‘<’ symbol in
them? Let’s try the same relation we’ve been using but with a ‘>’ symbol in
it:
Now we can’t really split this up into two parts
like we’ve done previously. We know that the area represented by is the area above
the line .
However, because our relation is only a larger than relation, it doesn’t
include the line.
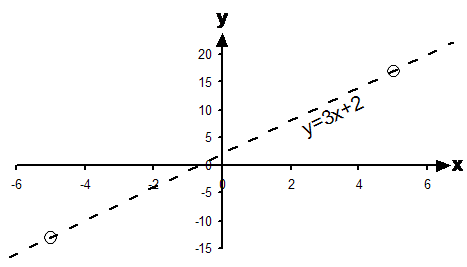
However, it’s pretty hard to draw the area properly unless we have a
line we can shade above. So what we do is draw in the line as a dotted line.
This tells the reader that the relation doesn’t include , but gives the
reader a better idea of what the shaded area actually is.
So first we just draw the dotted line so we know where to shade:
Then we add the shading above this dotted line:
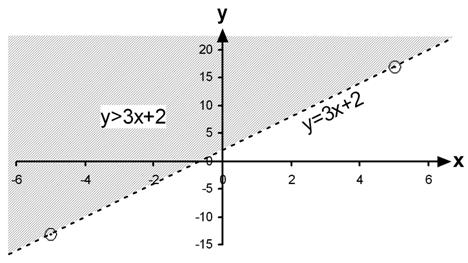
For a ‘<’ sign you’d get the same graph except with the shaded area below the dotted line instead of above it.