Going from an inequation graph to an inequation
You may also have to write down inequations based on graphs
you’re given. Basically, once again you need to find the y-axis intercept and
the gradient of the straight lines in the graph. Then, you need to decide what
type of inequation symbols you need –  . Remember that a dotted
line means that the line itself isn’t included in the area, whereas a solid
line means the line is included in the area of the graph.
. Remember that a dotted
line means that the line itself isn’t included in the area, whereas a solid
line means the line is included in the area of the graph.
|
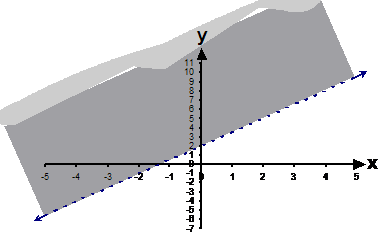
Write the inequation describing this graph:
|
|
Solution |
|
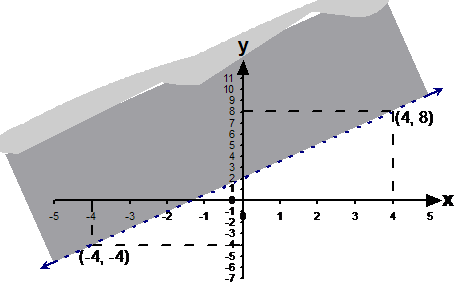
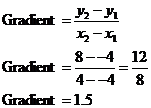
First up, we need to work out what the gradient and the intercept of the line in this graph is. The y-axis intercept is easy – it’s ‘2’. The gradient will take a bit of calculating:
So the equation of the dotted line is: But we want to write the inequation that describes the area in the graph. Because the line is dotted, it means that the line itself is not included in the area. So we’re only interested in the area above the dotted line, not including the dotted line itself. This means we need a “larger than” symbol: |


|
A shoe company makes two types of running shoes, a basic, no frills shoe, and a deluxe, high tech running shoe. The basic, no frills shoe is cheap and easy to make, but because it’s not a fantastic shoe, they have to sell it for a low price and hence only make a small profit per pair. The deluxe shoe is a lot better, but costs a lot more to make. Also, because the company had to spend a lot of money researching the technology used in the shoe, they need to get back their research costs in sales. This means that they’ll only start earning profit from the deluxe shoes after they’ve sold 10,000 pairs of them. But they can charge a lot more for the deluxe shoes, so the profit they make per pair of deluxe shoes sold is a lot higher. The company makes $5.00 profit per basic pair of shoes sold. They make $15.00 profit per deluxe shoe sold, but only on shoes sold after the first 10,000. a) Draw a graph showing the profit made as a function of the number of shoes sold in each line. b) How much money will the company make from selling 12,000 pairs of basic shoes? What about 12,000 pairs of deluxe shoes? c) Assuming that they sell the same number of pairs of deluxe shoes as basic shoes, at what point do the deluxe shoes become more profitable? |
|
Solution |
|
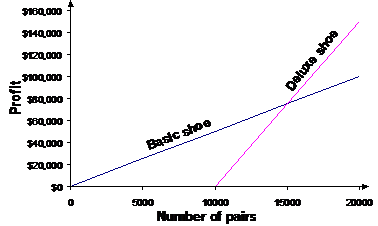
This is going to be a linear equations type of problem, since we have two relationships in our question. The first relates profit to the number of pairs of basic shoes sold: The second relationship is a bit more complicated – they only start making profit after they have sold 10,000 pairs of the deluxe shoes. One way of thinking about this is that they make a negative profit if they sell below 10,000 pairs. So we want our profit to only become positive when the number of pairs exceeds 10,000: When N is smaller than 10,000, the term in the brackets is negative, so the profit is negative. When N is larger than 10,000, the term in the brackets is positive, so the profit is positive. Now we can plot these two relationships on a graph as straight lines:
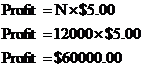
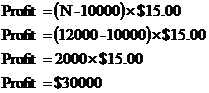
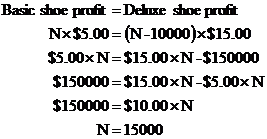
For part b), all we need to do is plug numbers into the two equations: For the basic shoes: For the deluxe shoes: Part c) asks about when the deluxe shoes start earning more money than the basic shoes. Obviously, when the shoes first start selling, the basic shoes are the best because initial sales of the deluxe shoes have to pay off the research and development costs. You can see that the basic shoe profit line in the left of the graph is in the positive, whereas the deluxe shoe profit line isn’t even on the graph (if you trace the deluxe shoe line backwards it’s actually in the negative profit area of the graph, below the x-axis). What we want is the critical point where the deluxe shoe profit line crosses over the basic shoe profit line and rises above it. This is the intersection of the two lines in the graph. This is a basic simultaneous equations problem, with the two equations being: The intersection point is where the total profits from each shoe are equal. This means we can equate these two equations: So the point at which the deluxe shoes become more profitable is when the company has sold 15,000 pairs of each shoe type (making a total of 30,000 pairs). |