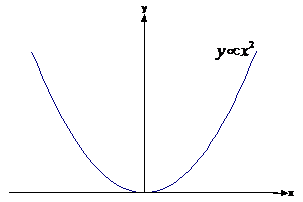
This takes some common sense. For instance, for  , we’d expect the
graph to pass through the origin, and as it heads to the right get higher and
higher, at a faster and faster rate. Also, as you head to the left of the
y-axis, you’d expect it to get higher and higher as well:
, we’d expect the
graph to pass through the origin, and as it heads to the right get higher and
higher, at a faster and faster rate. Also, as you head to the left of the
y-axis, you’d expect it to get higher and higher as well:
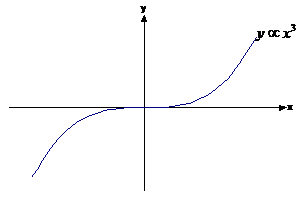
 however is a little bit different.
Going right from the x-axis, we’d expect the line to get higher and higher and
the slope to get steeper and steeper. However, in the negative x region, the
line’s actually going to be below the x-axis, because when you cube a
negative number the negative sign stays there in your answer. So going to the left
of the y-axis, the line’s going to get more and more negative and the slope’s
going to get steeper and steeper:
however is a little bit different.
Going right from the x-axis, we’d expect the line to get higher and higher and
the slope to get steeper and steeper. However, in the negative x region, the
line’s actually going to be below the x-axis, because when you cube a
negative number the negative sign stays there in your answer. So going to the left
of the y-axis, the line’s going to get more and more negative and the slope’s
going to get steeper and steeper: