If you have a quadratic function in the general form:

Then its graph will either look like a ‘hill’ or a ‘valley’.
· If ‘a’ is positive, it will be a valley.
· If ‘a’ is negative, it will be a hill.
The turning point of a quadratic function is the point where the vertical line of symmetry of the graph cuts through the hill of valley. In other words it is the peak of the hill, or the bottom part of the valley.
The turning point coordinates are given by
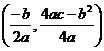
It is much easier to remember the turning point’s x value –
it is just  .
You can then substitute this x value back into your original equation to find
the y value of the turning point – rather than trying to remember the algebraic
expression for the y value in the brackets above.
.
You can then substitute this x value back into your original equation to find
the y value of the turning point – rather than trying to remember the algebraic
expression for the y value in the brackets above.
If ‘a’ is positive, the turning point is a minimum of the function – the smallest y value at any point in the function is at the turning point.
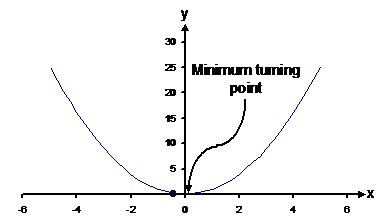
If ‘a’ is negative, the turning point is a maximum of the function – the largest y value at any point in the function is at the turning point.
When sketching a graph of a quadratic function, one more important piece of information should be displayed on the graph – the x-axis and y-axis intercepts.
To calculate the y-axis intercept, just set x = 0 in the quadratic function and work out what y equals. This is the value of the y-axis intercept.
To calculate the x-axis intercepts, just set y to equal 0. Then you’ll have your normal quadratic equation to solve, in the standard form:

The solutions you get for x are the x-axis intercepts.
There is always a y-axis intercept, but there is/are not always an x-axis intercept(s) for a quadratic curve.