Rates of change are very important in mathematics. Take for example the ‘speed’ of a car. It is a measure of how far the car travels over a certain time, usually expressed in km/hr. It literally means how many kilometres the car will travel per hour. It could also be expressed in km/s or m/s or mm/day. The important thing is that it is a measure of how much the distance changes for a certain change (increase) in time.
For instance, 100 km/hr says that for every change in time of one hour, the distance travelled changes by 100 km.
If you graph the distance travelled by a car on the y-axis, and the time taken on the x-axis, for some journey you might get a graph like this:
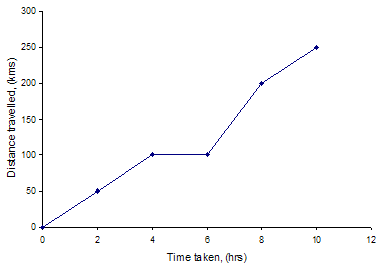
Now, for this graph (and any graph of distance vs. time), the gradient at any point represents the speed of the car at that time. For instance, between hours 0 and 4, the car is travelling at 25 km/hr. Between hours 4 and 6, the gradient is 0, telling us the car is not moving. Then, between hours 6 and 8 the gradient is 50 km/hr. Finally, between hours 8 and 10 the gradient is again 25 km/hr. In general, the slope of a graph can tell us the rate of change of the y-axis variable, with respect to the x-axis variable.
What about for graphs with curves?
You can still find the rate of change the same way, but you have to draw a tangent to the point where you want to find the gradient, like follows:
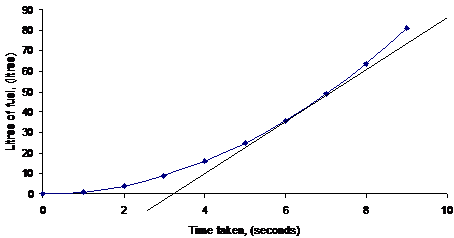
This graph shows a petrol tank being filled up at a gas station. Now we know that the gradient represents the rate of change of the amount of fuel with respect to the change in time. A steeper gradient means the change in fuel per second is greater. Since the line gets steeper and steeper the tank is being filled at a higher and higher rate as time progresses.
Say we want to find the filling rate after 6 seconds. We need the slope at that point. We construct our own straight line parallel to the curved line at that point – called a tangent. We then find the slope of our straight line and use that as our filling rate. For this example, at time = 6 seconds, the filling rate is about 12 L/s.