Inverse relationships are all about one thing doing the opposite of the other. When one variable gets bigger, the other gets smaller, and vice versa. Here’s the graph of a typical inverse relationship between x and y:
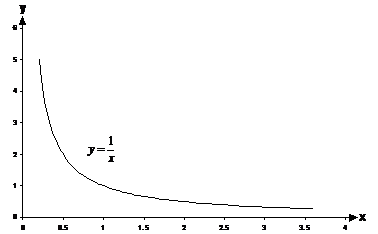
First of all, notice that you can’t actually plot the
graph right at x = 0, because y gets too big to fit on the graph. That’s why
the line doesn’t go all the way to the y-axis. Looking more to the right side
of the graph, the line almost flattens out. This is because as you get to
large values of ‘x’,  becomes very small and doesn’t
change much – for instance the difference between
becomes very small and doesn’t
change much – for instance the difference between  and
and  is only 0.002!
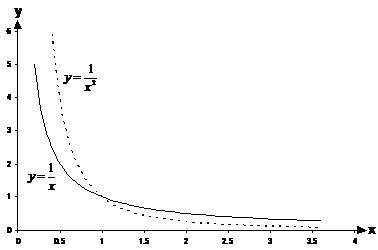
You can get inverse square  or inverse cubic
  relationships
too. They are more exaggerated – they get to very large values of ‘y’
much more quickly as the graph approaches the y-axis, and flatten out much more
quickly as you head towards large values of ‘x’.
relationships
too. They are more exaggerated – they get to very large values of ‘y’
much more quickly as the graph approaches the y-axis, and flatten out much more
quickly as you head towards large values of ‘x’.
If you include the negative side of the x-axis, the graphs look like this:
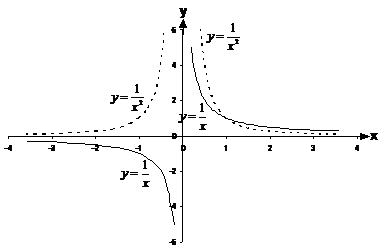
The  graph becomes negative on the left
side of the y-axis because when you divide 1 by a negative number, you get a
negative answer. However, the
graph becomes negative on the left
side of the y-axis because when you divide 1 by a negative number, you get a
negative answer. However, the  graph stays positive on the left
side of the y-axis, because of the square bit – the negative x values are being
squared to become positive numbers. 1 divided by a positive number gives you a
positive number.
graph stays positive on the left
side of the y-axis, because of the square bit – the negative x values are being
squared to become positive numbers. 1 divided by a positive number gives you a
positive number.
The graph of is mirror imaged across both
the x-axis and the y-axis. The graph of is mirror imaged only across
the y-axis.
When y varies inversely as x, we can write down this proportionality statement:

When y varies inversely as x2, we can write down this proportionality statement:

There is also a ‘k’ constant for inverse relationships. If I want to turn the proportionality sign into an equals sign, I replace the ‘1’ with a ‘k’, like this:
