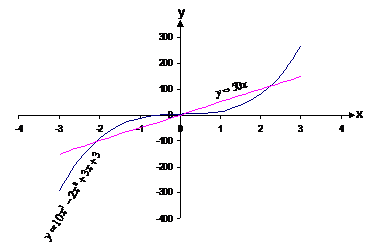
These two functions intersect each other at about x = –2, x = 0 and about x = 2.3. The difference function for these two functions would have to be integrated in two separate parts. One part would be from x = –2 to x = 0, the second from x = 0 to x = 2.3. It would have to be integrated in two bits because one bit would be a positive area, and the other negative. If it was done all in one go, these positive and negative areas would partially cancel each other out.
Say we calculated the difference function this way:
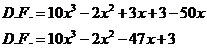
We can plot the graph of this difference function:
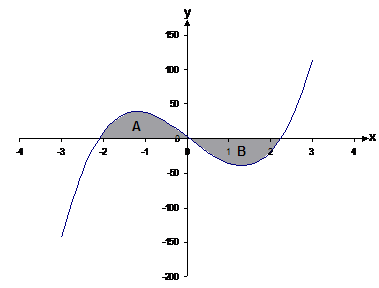
Once the two areas A and B had been calculated, their absolute values would be taken. Then to get the total area between the two functions, you could just add these two sub-areas. If you didn’t take their absolute values, the negative value of the B area would cancel against the positive value of the A area.