Amplitude transformations
Say I have to graph the function  . To get this graph, all
you do is take the normal sin(x) graph, and stretch it in the vertical direction by a factor of 2.
. To get this graph, all
you do is take the normal sin(x) graph, and stretch it in the vertical direction by a factor of 2.
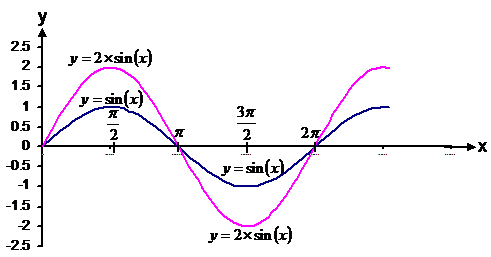
If the number had been ‘–2’, you would stretch the graph in the vertical direction by a factor of 2, then take its mirror image about the x-axis.
Sideways movement
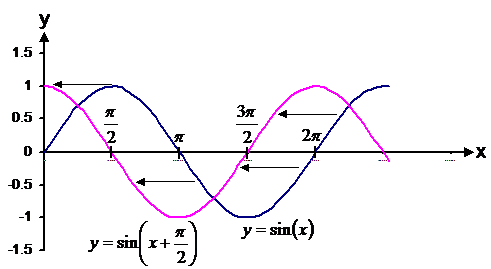
What about if I have to graph 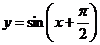 ? If the sign in the
brackets is positive, this
shifts the graph to the left
by whatever is to the right of the ‘+’ sign. If the sign is negative, this shifts the graph to
the right by whatever is to
the right of the ‘–’ sign. Since in this case, the sign is positive, it shifts
the graph
? If the sign in the
brackets is positive, this
shifts the graph to the left
by whatever is to the right of the ‘+’ sign. If the sign is negative, this shifts the graph to
the right by whatever is to
the right of the ‘–’ sign. Since in this case, the sign is positive, it shifts
the graph  to
the left.
to
the left.
Horizontal squashing or stretching
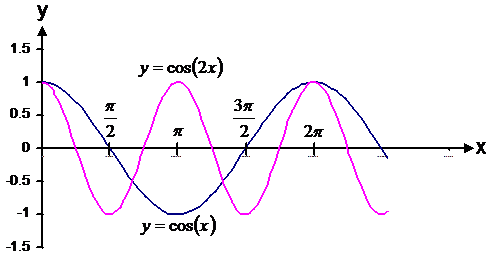
Another type of function you might have to plot is
something like .
This time the 'x' has a coefficient
in front of it. When this coefficient is larger than 1 (as it is
in this case), the graph is compressed sideways (horizontally). If it is
smaller than 1, the graph is stretched sideways. In this case, since 2 is
larger than 1, the graph is compressed sideways by a factor of 2.
.
This time the 'x' has a coefficient
in front of it. When this coefficient is larger than 1 (as it is
in this case), the graph is compressed sideways (horizontally). If it is
smaller than 1, the graph is stretched sideways. In this case, since 2 is
larger than 1, the graph is compressed sideways by a factor of 2.
Vertical displacements
For a function like  , all you do is shift the entire
  curve upwards by
2 units.
curve upwards by
2 units.
Sign changes
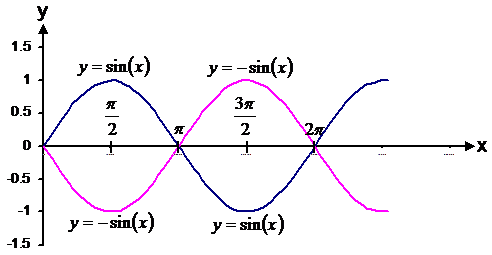
Say I want to draw the curve  . The easy way to do this is to
first draw the curve
. The easy way to do this is to
first draw the curve  , then simply reflect it over the
horizontal line of symmetry – the x-axis in this case.
, then simply reflect it over the
horizontal line of symmetry – the x-axis in this case.
What about when the negative is actually inside the
brackets? An example of this would be  . For this curve, you need to
remember that
. For this curve, you need to
remember that 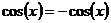 ,
so they are the same curve. However, say you had to plot
,
so they are the same curve. However, say you had to plot  . For this you need to
know that
. For this you need to
know that  .
So to draw ,
you would first draw . Then you would reflect it over
the horizontal line of symmetry (usually the x-axis) to get .
.
So to draw ,
you would first draw . Then you would reflect it over
the horizontal line of symmetry (usually the x-axis) to get .
Putting it all together
Often you will have to plot quite complex functions that involve sometimes all of these things. Whenever you get a function to plot, you want to get it in the general form:

or 
or 
Remember that ‘b’, ‘c’, and ‘d’ can be zero – the result is usually a simpler function.
|
Plot the following function for |
|
Solution |
|
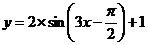
This equation is already in the general form that we
desire. Since it is a sin
function, we first draw the simplest curve we know,
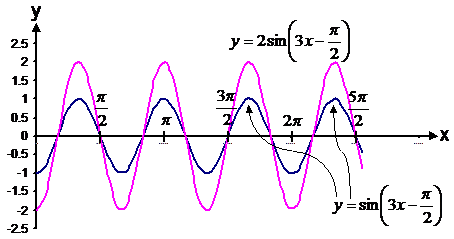
The next part to deal with is the ‘ The next step is to allow for the 2 in front of the
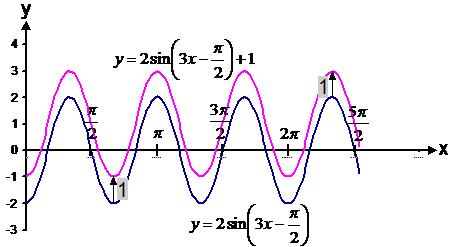
The last step is to allow for the ‘+1’. This is also very simple – we shift the curve up by 1 in the vertical direction. So by using a step by step approach, you can break up a fairly hard problem into easy bits that by themselves are quite simple.
|
 :
:
 . This is
simply the
. This is
simply the 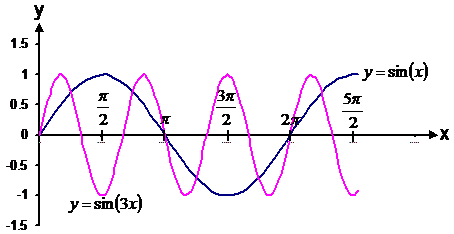
 ’ part. We can
plot
’ part. We can
plot  simply
by shifting the
simply
by shifting the  . Why do we shift the
graph by
. Why do we shift the
graph by  ?
This is because of the 3 in front of the ‘x’. If it had just been
?
This is because of the 3 in front of the ‘x’. If it had just been  then we would
have shifted the graph by
then we would
have shifted the graph by 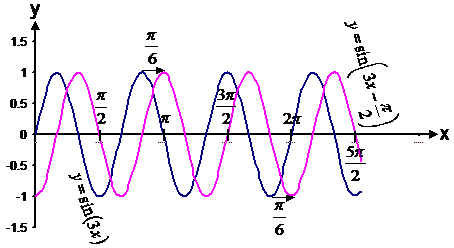
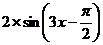 . This is
easy to do – we just stretch the graph vertically by a factor of 2. Now the
curve goes from –2 to 2 in the y direction, instead of –1 to 1 as it did previously.
. This is
easy to do – we just stretch the graph vertically by a factor of 2. Now the
curve goes from –2 to 2 in the y direction, instead of –1 to 1 as it did previously.