Sometimes you can have functions that have asymptotes that are neither vertical nor horizontal, but at an angle. The approach used to plot these functions is still the same, however.
|
Sketch the following function: |
|
Solution |
|
The function is undefined at x = 1 – the denominator equals 0. First, we see how the function behaves as we approach the four points: Approaching The function becomes Approaching The function approaches a very large negative number. For x values just below 1, the numerator is positive and the denominator is a very small negative number. Approaching The function approaches a very large positive number. For x values just above 1, the numerator is positive and the denominator is a very small positive number. Approaching The function becomes So at both large negative and large positive values
of x, the function is very close to a straight line described by the function
The next thing to check for is x-axis and y-axis intercepts: · y-axis intercepts happen when x = 0 – there is a y-axis intercept at y = 0. · x-axis intercepts happen when y = 0 – there is an x-axis intercept at x = 0. We can sketch this preliminary information on a graph:
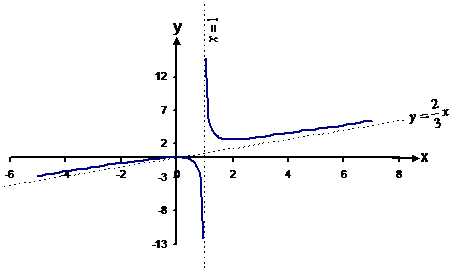
The graph passes through the origin. From looking at the sketch so far, it looks like the left-hand side of the graph will be what passes through the origin. Now all you do is connect up the lines, remembering the intercept through the origin. You can also draw the two asymptotes in as straight dotted lines:
Some notes The first function sketched in this section was a
fairly easy, standard sort of asymptote graph. The function we just sketched
for this question is an example of a more complicated sort of graph. For
example, the right hand part of the curve does not cross the The only way to tell that this happens is to use the
axis intercept information – we found that the left hand part of the curve
crossed through the origin. So we drew the curve through the origin, and
then brought it back towards the |

 :
: for large negative values of x,
since you can ignore the ‘
for large negative values of x,
since you can ignore the ‘ ’. This simplifies to
  .
. from the negative side:
 :
: . Near large negative and positive
values of x, the function follows this asymptote. There is also a vertical
asymptote at x = 1, where the function is undefined. You can draw what the
function looks like near this as well.
. Near large negative and positive
values of x, the function follows this asymptote. There is also a vertical
asymptote at x = 1, where the function is undefined. You can draw what the
function looks like near this as well.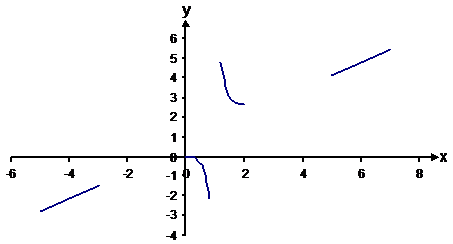
 asymptote, but
the left-hand part does.
asymptote, but
the left-hand part does.In general, if you have time, try and work out as many characteristics of the graph before you plot it – find any turning points, points of inflection, axis-intercepts…the more information you have, the easier it will be to plot. For the function just sketched, if we had not found the axis intercepts, we might have drawn a different sketch to that shown. If you don’t find out enough information about the function, you can sketch a graph that is correct for the information you do have, but you will find further information will show your sketch is wrong. In general, find out as much information as you can before you start plotting.