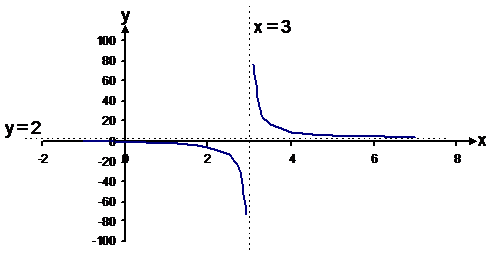
Some graphs are not defined for all values of x. By not defined, we mean there is no y-value for that x-value.
The following function is undefined at x = 3:

When x = 3, the denominator is equal to 0, so we have:
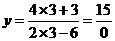
This is undefined. Since there is a point where y is not defined, we can say that this function is discontinuous at x = 3. This means it does not have a y-value for every x-value. To plot a function like this, you need to look at a few things.
Firstly, you find where the function is undefined – in this case at x = 3. Then you work out what sort of value the function has at four points:
Approaching  :
:
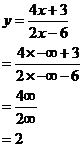
The 3 and the –6 can be ignored as they are
insignificant when compared with  .
.
Approaching  from the negative side:
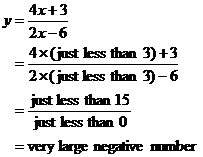
Approaching from the positive side:
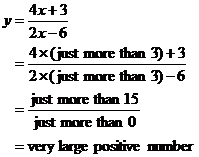
Approaching  :
:
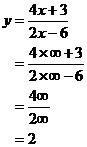
Now, I can use this to plot my function near these points:
·
Towards , y approaches 2. Approaching x =
3, from the negative side, y approaches a very large negative number. So when
I travel right from towards x = 3, my function is
getting more negative – it is decreasing.
·
Towards  , y approaches 2 again. However,
approaching x = 3 from the positive side, y approaches a very large positive number. So if I travel left from to x = 3, my
function is getting more positive – it is increasing.
, y approaches 2 again. However,
approaching x = 3 from the positive side, y approaches a very large positive number. So if I travel left from to x = 3, my
function is getting more positive – it is increasing.
With this in mind, I can draw the function around these
four points. Since I can’t draw it all the way to or , I just go a reasonable
distance from the y-axis.
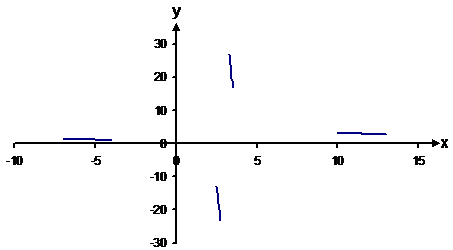
Now it is just a simple task of joining up the lines. Since the function is undefined at x = 3, you can draw a vertical dotted line there – a vertical asymptote.
You can also draw a horizontal asymptote at y = 2 since y does not actually ever get to 2.